
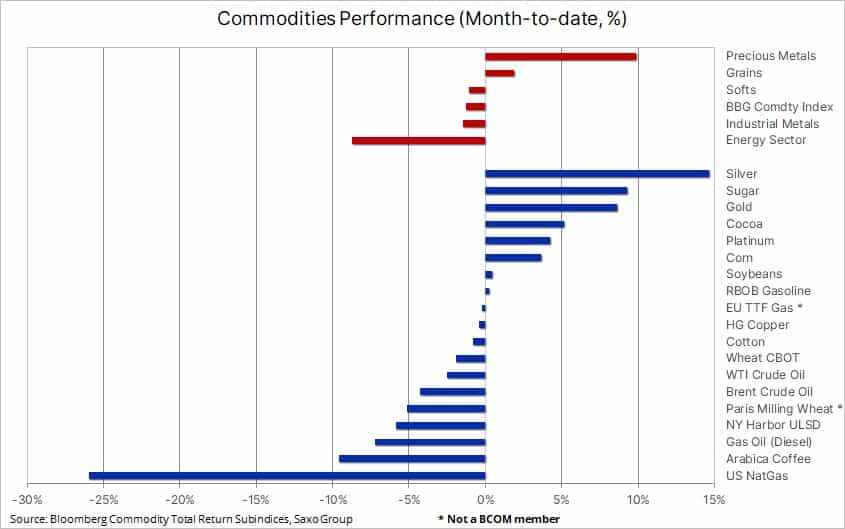
DUBAI, UAE — Following a month of turmoil in the banking industry, the Bloomberg Commodity Index experienced a modest monthly decline of 1.2 percent. A strong recovery from a mid-month sell-off, which briefly pushed the index to a 14-month low, helped avoid a deeper selloff. This was amid concerns about an economic slowdown impacting demand, particularly in Europe and the US, where financial stress was most pronounced. China’s economic recovery accelerated in March, with stronger manufacturing, services, and construction data boosting growth prospects and supporting sentiment.
The energy sector experienced significant weakness, with a nearly 9 percent decline exacerbated by a 26 percent drop in US natural gas futures. Conversely, gold and silver benefited from a substantial decrease in US government bond yields, a weaker dollar, and a sharp downward adjustment in future rate expectations from the US Federal Reserve. Despite easing turmoil in the banking sector towards the month’s end, precious metal prices remained near a cycle high, as investor demand continued to recover amid expectations of sustained tailwinds in the coming months.
The grains sector was on track for its first monthly gain this year, bolstered by a resurgence in corn prices due to increased export demand and forced short covering following a four-week period of record selling activity. Technical and fundamental outlook improvements signaled the shift. Cocoa prices reached a three-year high amid tight supply and concerns of a slowdown in West African shipments, partly due to diseases and unfavorable weather conditions. Meanwhile, sugar prices reached a six-year high amid disappointing sugarcane output in Thailand and India, as well as changes in Brazilian state fuel taxes, raising concerns that more sugarcane would be used for ethanol production instead of sweetener.
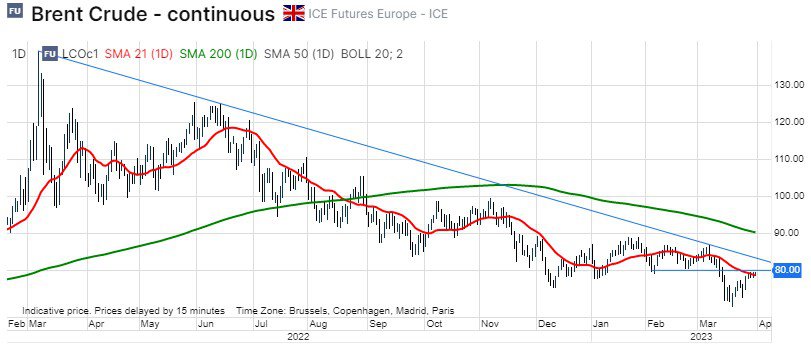
Crude oil prices, represented by Brent and WTI, the world’s two leading futures contracts, recouped roughly half of the losses experienced in early March, which accelerated mid-month due to the intensifying banking crisis. The selloff’s strength was primarily driven by speculators and hedgers needing to reduce their net long positions rather than the market pricing in a worsening demand outlook. This explains why the price managed to recover back to around $80 for Brent and $75 for WTI after the initial selling phase.
Before the abrupt selloff, crude oil had experienced months of sideways trading, reducing volatility and forcing speculators to increase their positions. With Brent trading in a supportive backwardation structure, the focus was mainly on building long positions in anticipation of a price rally as demand improved. When the crisis emerged, crude oil broke support, triggering a wave of selling from both long liquidation and fresh short selling attempts.
During the two weeks leading up to March 21, hedge funds sold WTI and Brent at the fastest pace in over a decade, with the combined net long plummeting by 233k lots, or 233 million barrels of crude oil, to a three-year low at 241k lots. WTI was hit particularly hard, with the net long falling to 71k lots, its lowest level since 2016. As prices recovered with improved risk sentiment, short positions were forced to cover.
Crude oil traded firmly ahead of month-end, with the recent recovery driven by ongoing supply disruptions from Northern Iraq due to disputes between Baghdad and the Kurdistan region, a weaker dollar, the largest drop in US crude stocks since November, continued strength in China’s recovery, and improved risk sentiment forcing short covering. In a monthly survey published by the Dallas Fed, shale oil basin executives expressed concern about capital spending plans in 2023 due to uncertainty regarding the depth and duration of the banking crisis. Access to credit, record costs from labor shortages, and supply chain issues have contributed to slowed production growth.
We maintain a moderately bullish outlook for crude oil, as we are concerned that the majority of the expected 2-million-barrel-per-day increase in global demand this year is forecasted to occur during the second half. Bearing this in mind, a deeper-than-expected slowdown, as indicated by current U.S. rate cut expectations, may reduce eventual growth and thus limit crude oil’s upside later this year. However, in the short term, a break above $80.40 in Brent is likely to signal a return to the range that prevailed before the mid-March correction.
Gold’s short-term upside potential is challenged by the gap
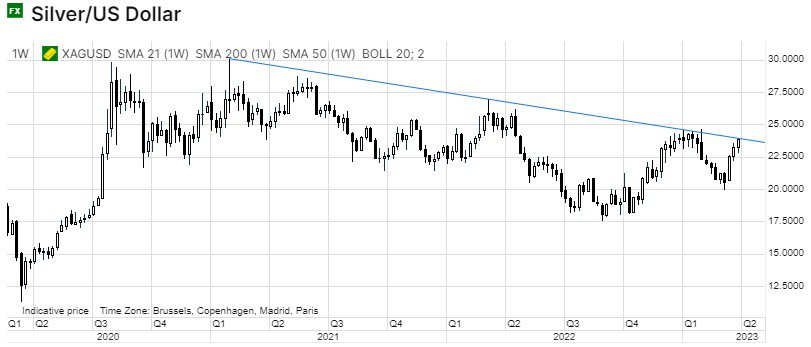
Following a month of turmoil in the banking industry, gold and silver are on track for monthly gains of around 8 percent and 14 percent respectively. Despite easing tensions over the past week, both metals have managed to retain most of their gains in anticipation of a near-term peak in U.S. rates, followed by a series of rate cuts. This outlook could be challenged by the fact that the current 60 percent probability of a recession is likely too high, particularly when compared to an economic landscape that still sees high inflation, full employment, and resilient consumers.
The collapse of Silicon Valley Bank has driven a U-turn in future rate expectations, shifting from additional hikes to expectations of a 100-basis-point cut in the coming months. The market seems eager to force a recession; however, in our view, the path is more of a “slow recession” rather than a collapse. At Saxo, we see no cuts between now and September, potentially leaving the precious metals market exposed should economic data, particularly inflation figures, continue to show strength.
Nonetheless, the fact remains that the timing of peak rates has moved much closer. The combination of fresh demand for gold from ETF investors, momentum buying from hedge funds, and continued physical demand from central banks will likely drive gold and silver prices higher once the wide gap between current and future (lower) Fed funds rates begins to narrow.
On the upside, $2000 remains the key level to watch for gold, with support seen at $1933, the 38.2 percent retracement of the recent run-up to $2010. In silver, keep an eye on a weekly close above $23.90, as it may signal a breakout from a two-year downtrend.
Grains on the move ahead of key planting report
The Bloomberg Grains Index, which tracks the performance of six major US grain and soy contracts, reached a five-week high driven by a 3.6 percent gain in corn amid increased demand from China for US grain. Concurrently, wheat traded briefly above $7 due to concerns that Russia may seek a temporary pause in its sales of wheat and sunflower oil to achieve higher prices. Furthermore, dry conditions across the US Plains have elevated the price of May Kansas hard-red winter wheat (HRW), providing some support to the Chicago soft-red winter (SRW) variety.
These price-supportive developments occurred just after speculators had aggressively sold, particularly corn, while the market was preparing for the release of a key report from the US Department of Agriculture. The Quarterly Stocks and Prospective Planting reports were expected to reveal the smallest wheat and corn stocks in 15 and 9 years, respectively. Additionally, a 19 percent reduction in cotton acreage to 11 million acres and reductions in other smaller crops led to expectations that farmers would plant larger areas of soybeans (1 percent to 88.3 million acres), corn (2.6 percent to 90.9 million), and notably wheat (9 percent to 48.9 million), the largest acreage allocation in seven years. Note that the results of these potentially market-moving reports were not available at the time of writing.
Copper remains supported by falling stockpiles and China demand
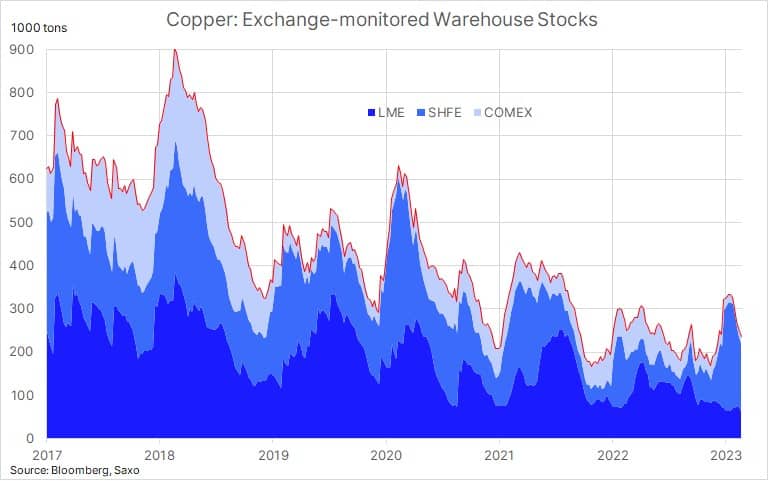
Copper has rebounded from losses experienced during the mid-month banking crisis-related sell-off, highlighting the underlying demand for a metal with increasing demand from electric vehicles, renewable power generation, and energy storage and transmission. This demand is offsetting the property slowdown in China – a key source of demand in recent years – and an economic slowdown in the West.
Visible copper inventories monitored by futures exchanges in Shanghai, London, and New York have declined by 29 percent in the past five weeks. Goldman Sachs suggests that if the current trend of surging demand in China persists, visible global copper stockpiles could be depleted by August. On the other hand, global production continues to recover from a fourth-quarter slump when production issues in Chile and Peru, as well as lockdowns in China, triggered a 19 percent quarter-on-quarter reduction – the lowest output in six years, according to S&P Global.
HG copper has traded within a downtrend since mid-January, initially driven by disappointment over the pace of China’s economic recovery and growth concerns elsewhere. Recently, as banking worries eased, a continuous decline in warehouse-monitored stocks has seen the price settle into a $4.00-$4.15 range. Managed money accounts, which flipped their net position from a +40,000 contract long on January 31 to a 7,000-contract short seven weeks later, will be forced to buy should an upside breakout occur.
Finally, a warning about leveraged ETFs
We typically do not focus on leveraged ETFs – products often misunderstood by investors and with a poor ability to track the performance of the underlying instrument over time – as they are best avoided or used only for very short-term directional trading strategies.
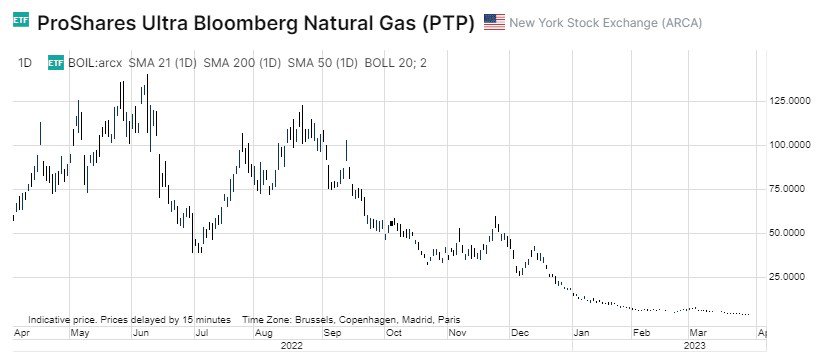
As humans, we are often drawn to mean reversion trades, such as looking for a stock to bounce back after a significant sell-off. A prime example is the BOIL ETF, which seeks daily investment results that correspond to twice (200 percent) the performance of the Bloomberg Natural Gas Sub-Index. Despite a 47 percent price collapse in March, the ETF managed to attract $235 million in fresh investor flows, and to recoup that loss, the ETF now needs to rise by over 87 percent.
When held over an extended period, this ETF proves challenging to manage, and the one-year loss of 93 percent reflects not only the current weakness in natural gas but also the significantly elevated contango that erodes returns with each underlying futures roll. Over a five-year period, the front-month natural gas contract has traded down 25 percent, while the BOIL ETF has lost nearly 99 percent of its value.
Ole S Hansen is the Head of Commodity Strategy at Saxo Bank.
The opinions expressed are those of the author and may not reflect the editorial policy or an official position held by TRENDS.